Visualization of global sea level projections - AR5 sea level rise
Description
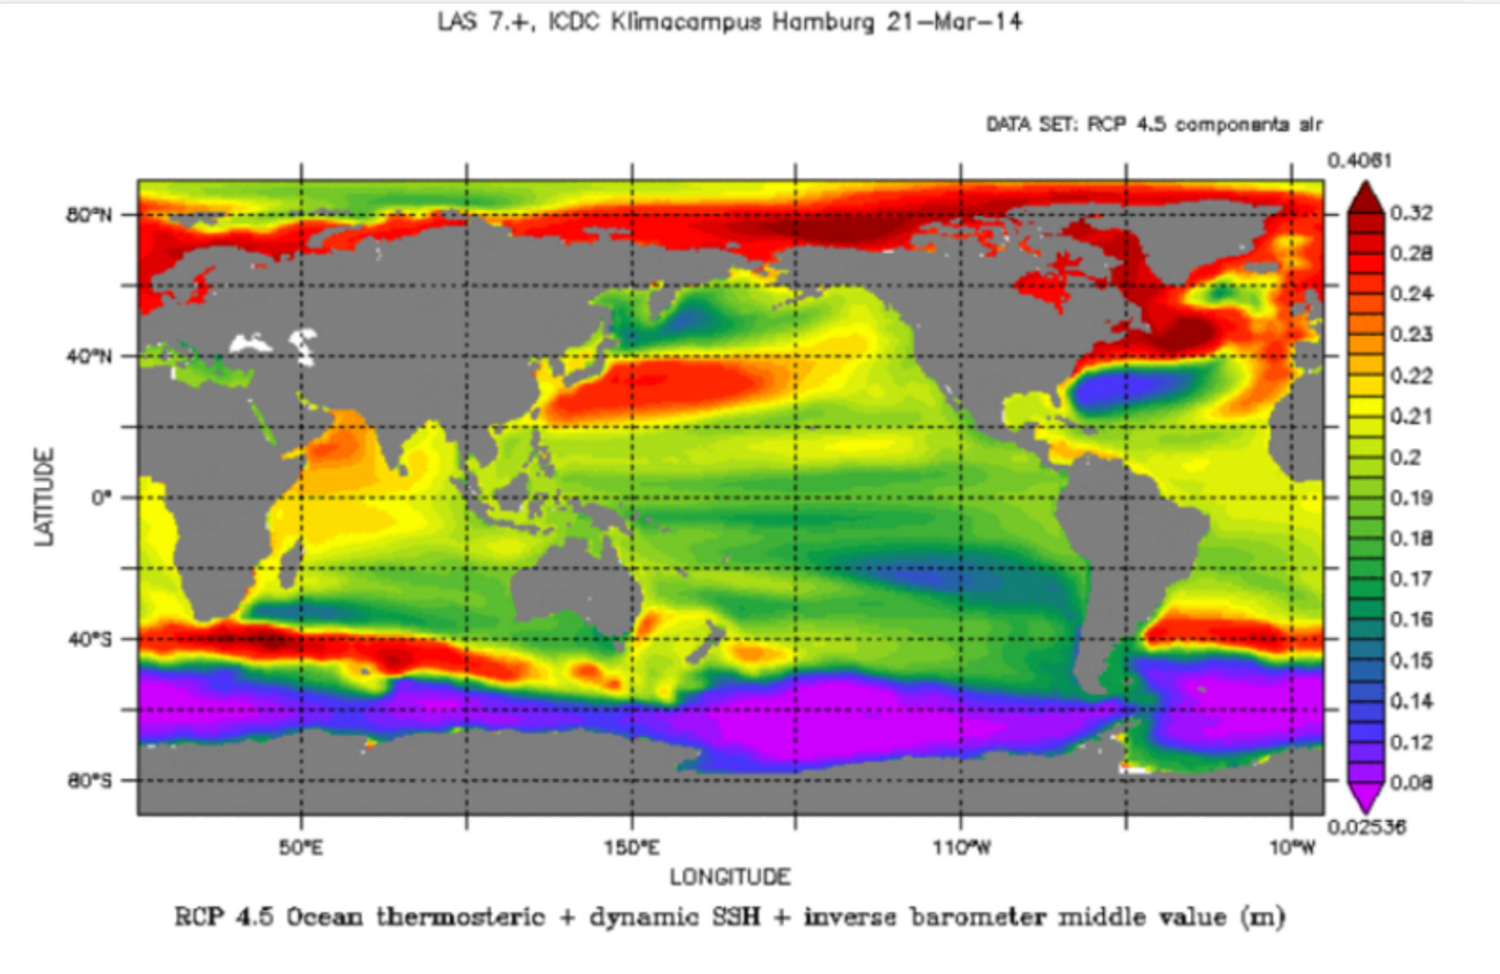
These are the relative (to the seafloor) sea surface height (SSH) data, which was used in the construction of figures for the Fifth Assessment Report of the Intergovernmental Panel on Climate Change (IPCC-AR5). The data include 10 geophysical sources that drive long-term changes in relative SSH:
- 5 ice components (Greenland dynamic ice and surface mass balance, Antarctic dynamic ice and surface mass balance, and glaciers),
- 3 ocean-related components, all of which are derived from CMIP5 models (dynamic SSH, global thermosteric SSH anomaly, and the inverse barometer effect from the atmosphere),
- land water storage (also called terrestrial water),
- and glacial isostatic adjustment (as a change in sea level relative to land).
In addition to the relatively few fields actually used in the IPCC-AR5 figures, all individual components are available here, both as maps of 20-yr mean differences (always the 2081-2100 mean minus the 1986-2005 mean), and as time series with the 1986-2005 mean set as the common zero SSH anomaly value.
All processing methods and data sources are defined in chapter 13 of the Supplementary Material (see References). Some further details, including combining uncertainties from different components, are included in a readme file.
Parameters
| Name | Unit |
|---|---|
| for RCP 4.5 and 8.5: | |
| total ensemble mean ssh ts | m |
| 5% uncertainty ssh ts | m |
| 95% uncertainty ssh ts | m |
| for RCP 2.6, 4.5, 6.0, 8.5 and for every component: | |
| middle value (i.e., central estimate) | m |
| 90%CL lower uncertainty estimate (p=0.05) | m |
| 90%CL higher uncertainty estimate (p=0.95) | m |
| standard error | m |
Coverage, temporal and spatial resolution
Period and temporal resolution:
- 2007 until 2100
- yearly
Coverage and spatial resolution:
- spatial resolution: 1°x1°
- Geographic Latitude: -90°N to 90°N
- Geographic Longitude: 0°E to 360°E
Format:
- netCDF
Data quality
See description.
References
Data citation
Please cite the data as follows:
Church, J. A., P. Clark, A. Cazenave, J. Gregory, S. Jevrejeva, A. Levermann, M. Merrifield, G. Milne, R.S.Nerem, P. Nunn, A. Payne, W. Pfeffer, D. Stammer, and A. Unnikrishnan (2013), Sea level change, in Climate Change 2013: The Physical Science Basis, edited by T. F. Stocker, D. Qin, G.-K. Plattner, M. Tignor, S. Allen, J. Boschung, A. Nauels, Y. Xia, V. Bex, and P. Midgley, Cambridge University Press, Cambridge, UK and New York, NY. USA
and acknowledge the source of your data download as:
Regional sea level data from IPCC AR5 distributed in netCDF format by the Integrated Climate Data Center (ICDC, icdc.cen.uni-hamburg.de), University of Hamburg, Hamburg, Germany.