Ocean tides from the high-resolution data-assimilative HAMTIDE model
Description
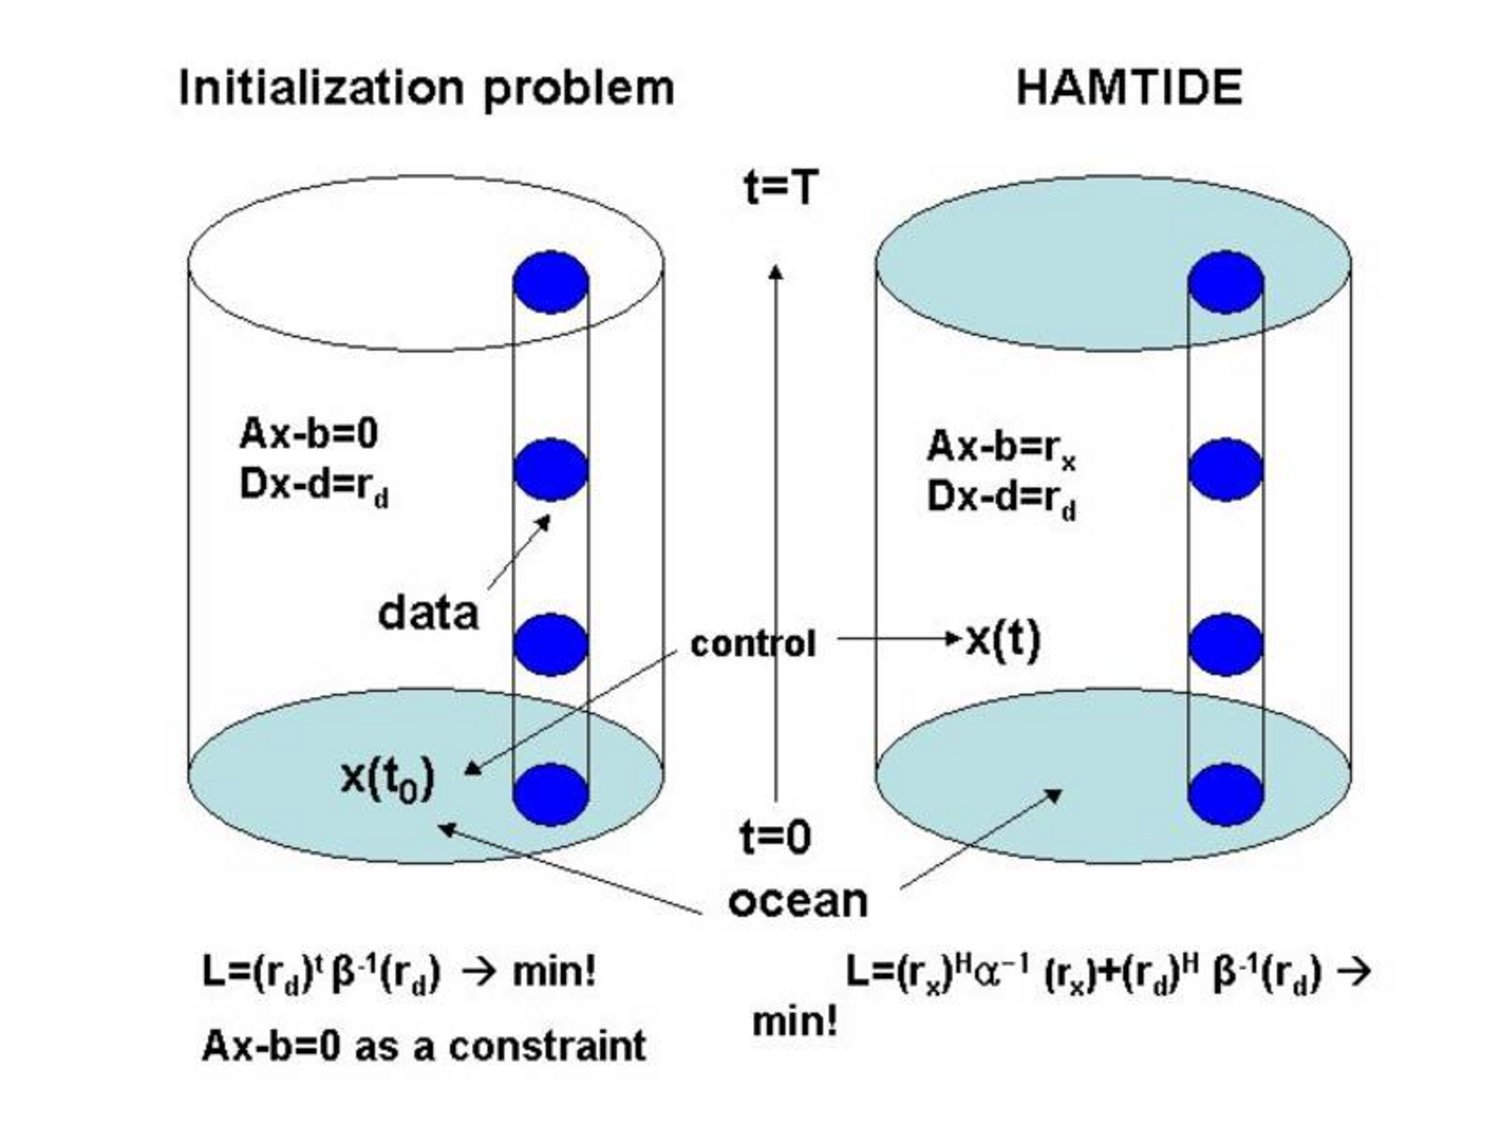
All numerical models are subjected to errors and results are hence incomplete. Specifically with respect to tide models there may be many causes for concern, including unknown dissipation parameters [Taguchi et al., 2014] inexact bathymetry, uncertainty in initial and boundary conditions, missing physics, especially in shallow seas [Taguchi, 2004; Setiawan, 2007]. Constraining tide models through geophysical data reduce this deficiency and can help to determine missing physics or uncertain parameters. However conventional data assimilation methods are afflicted with difficulty in handling the rapid growing number of altimeter data and above all in reproducing the non-linear tides in shallow water regions. The tide model HAMTIDE (Hamburg direct data Assimilation Methods for TIDEs) of the Institut für Meereskunde of the University Hamburg was developed to overcome those issues.
It is based on the generalized inverse methods for tides developed at the University of Hamburg [Zahel, 1995]. The principle of the HAMTIDE is the direct minimization of the model deficiency and the inaccuracy of the recordings in a least square sense, resulting to solve the over determined algebraic equations and so called normal equation respectively. The equations are then solved by a memory saving iterative method for the given sparse matrix and the model is corrected simultaneously by inferring the physics from data. The dynamic residuals are then used for the detection of possible model errors such as bathymetry, parameterization of dissipation, loading and self-attraction (LSA) and so on [Taguchi et al., 2014].
HAMTIDE is run with spatial resolution 7.5’. Solutions were constrained by data from the past on ongoing satellite altimeter missions as compiled by the DGFI altimeter data bank obtained from 15 years time series observed by TOPEX and Jason-1 [Bosch et al., 2009]. Altimeter data were provided in form of an empirical analysis of cross-calibrated multi-mission satellite altimeter data providing constituents such as M2, S2, N2, K2, K1, O1, Q1, P1 und 2N2.
Amplitude (AMPL) and phase (PHAS) of water elevation ζ(x,y) are denoted by a complex number like: ζ(x,y) = RE + i * IM with RE = AMPL * cos(PHAS) and IM = AMPL * sin(PHAS) and they are given in the following order:
| LON | LAT | RE | IM | AMPL | PHAS |
|---|---|---|---|---|---|
| 324.000 | 83.625 | 0.4718 | 3.1347 | 3.17 | 81.44 |
Parameters
| Name | Unit |
|---|---|
| Amplitude | cm |
| Phase (Greenwich) | degree (°) |
Coverage, spatial and temporal resolution
Period and temporal resolution:
- No period, Result from Model / Assimilationexperiment using data from a total of 15 years
- No temporal resolution
Coverage and spatial resolution:
- Global
- Spatial resolution: 7.5' x 7.5', cartesian grid
- Geographic longitude: 0.0°E to 360.0°E
- Geographic latitude: -90.0°N to 90.0°N
- Dimension: 1441 rows x 2881 columns
- Altitude: 0.0m
Format:
- NetCDF
Available constituents:
- Astronomical semidiurnal tides:
M2: Principal lunar, S2: Principal solar, N2: Larger elliptical lunar, K2: Declinational solar/lunar, 2N2: Second-order elliptical lunar
- Astronomical diurnal tides:
K1: Principal solar/lunar, O1: Principal lunar, P1: Principal solar, Q1: Larger elliptical lunar
Data quality
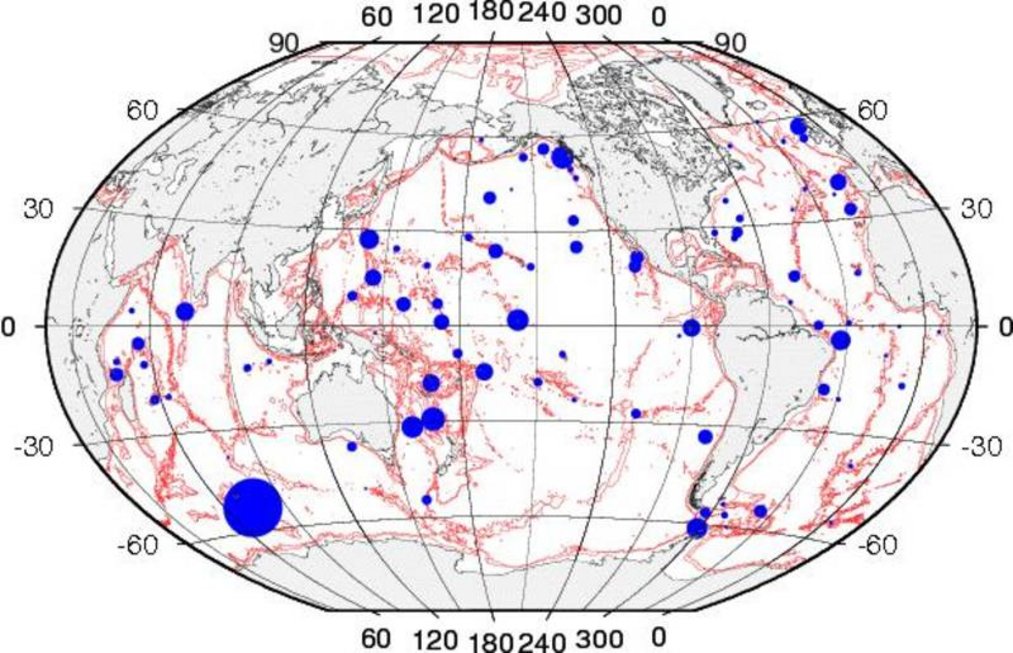
Comparisons are made between HAMTIDE and reference pelagic data set (Fig. 2), ST102p that are provided by R. Ray [2007], also against the FES tide model [Lyard et al., 2006], taking M2, S2, N2, K2, K1, O1, Q1, P1 and 2N2 major constituents as an example. Note that the FES model assimilated the ST102p data set, even though, RMS differences between HAMTIDE and FES2004 for 9 constituents are within 1 mm at the ST102p.
RMS difference (in cm) between ST102p pelagic tidal constituents and HAMTIDE/FES2004 solutions, respectively.
| Model | HAMTIDE | FES2004 |
|---|---|---|
| Resolution | 7.5' | - |
| M2 | 1.5 | 1.4 |
| S2 | 1.0 | 0.9 |
| N2 | 0.7 | 0.7 |
| K2 | 0.4 | 0.5 |
| K1 | 1.1 | 1.0 |
| O1 | 0.8 | 0.7 |
| P1 | 0.4 | 0.4 |
| Q1 | 0.3 | 0.3 |
| 2N2 | 0.3 | 0.3 |
References
Ray R. G. (2007), ST102p data set, personnel communication
Setiawan, A. (2007), Modelling Over- and Compound Tides of the Irish and Celtic Seas using Variational Data Assimilation Methods, Thesis, University of Hamburg, Hamburg, Germany, http://www.sub.uni-hamburg.de/opus/volltexte/2007/3403/
Taguchi, E. (2004), Inverse Modellierung nichtlinearer Flachwassergezeiten und ihre Anwendung auf ein Randmeer, Berichte aus dem Zentrum fuer Meeres- und Klimaforschung,47.http://www.sub.uni-hamburg.de/opus/volltexte/2004/1159/.
Data citation
Distributed in netCDF format by the Integrated Climate Data Center (ICDC, icdc.cen.uni-hamburg.de) University of Hamburg, Hamburg, Germany.