Coastal Sea Level Projections
Description
These are the relative (to the seafloor) sea surface height (SSH) data, which was used in the analyses and construction of figures for the journal article “Coastal sea level changes, observed and projected during the 20th and 21st century” (Carson et al., 2016). While this paper focus on the coastal values of the sea level rise, the data over the whole ocean is presented in Slangen et al. 2014.
Timeseries of observed and projected sea level changes for the 20th and 21st century are analyzed at various coastal locations around the world that are vulnerable to climate change. Observed time series are from tide gauges and altimetry, as well as from reconstructions over the last 50 years. CMIP5 coupled atmosphere-ocean model output of regional sea-level and associated uncertainty estimates are merged with scenario-independent contributions from GIA and dynamic ice to provide time series of coastal sea-level projections to the end of the 21st century.
The data available from this page are only the data which differ from the sea level data on the AR5 Sea Level Rise page; the data different from the AR5 Ch. 13 data include:
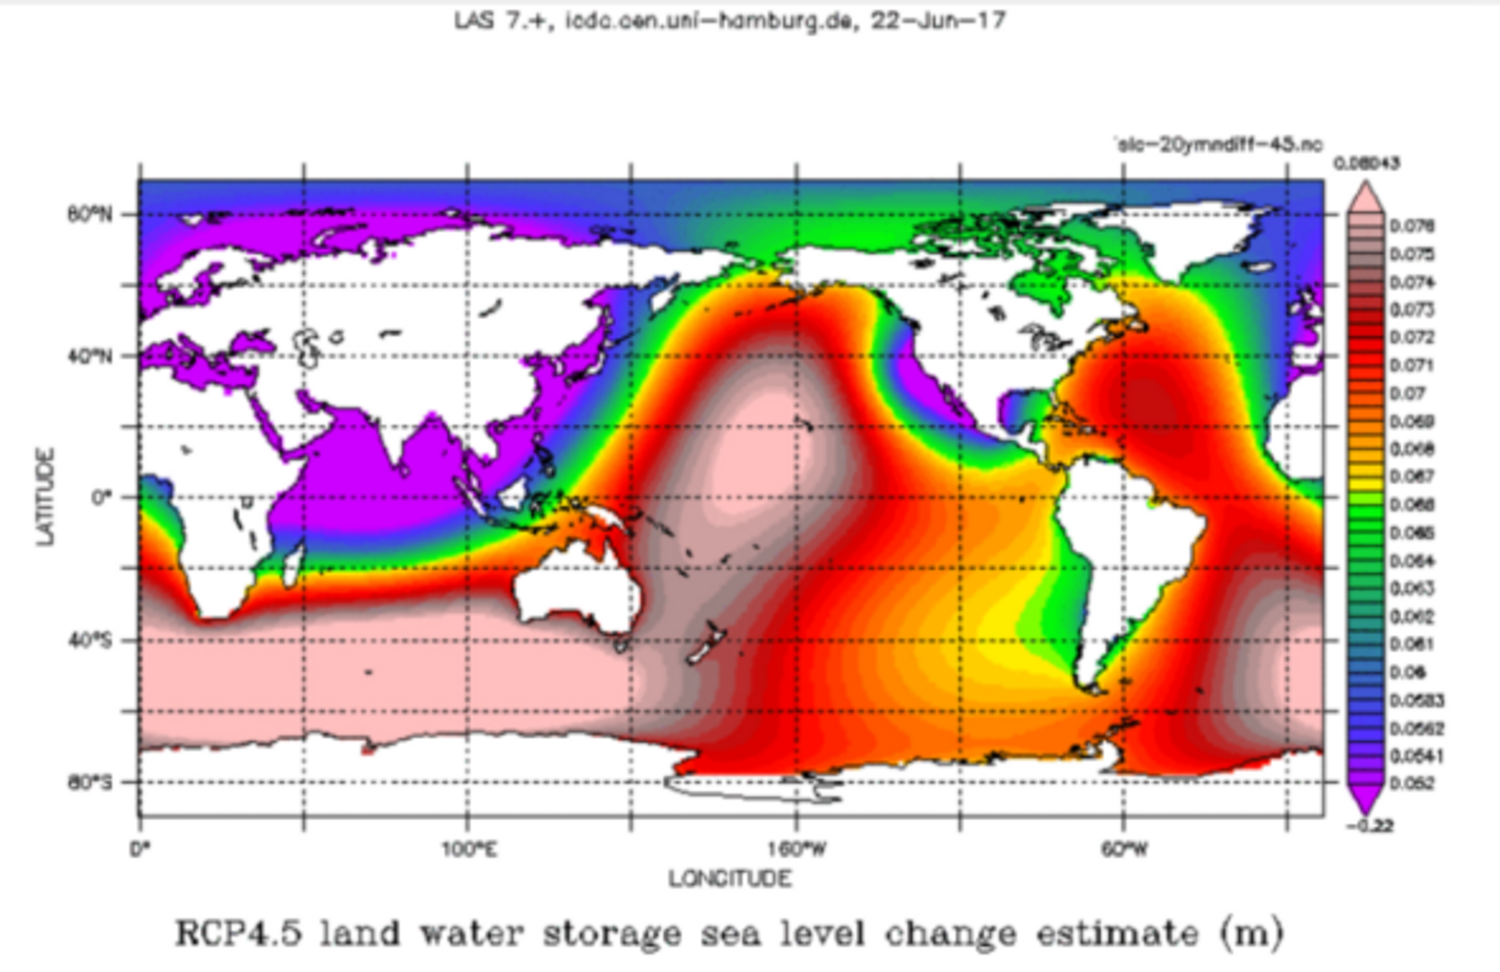
- 5 ice components (Greenland dynamic ice and surface mass balance, Antarctic dynamic ice and surface mass balance, and glaciers),
- land water storage (also called terrestrial water),
- and glacial isostatic adjustment (as a change in sea level relative to land).
The common data between the two studies can be found on the AR5 Sea Level Rise page, and are only the 3 ocean-related components, all of which are derived from CMIP5 models (dynamic SSH, global thermosteric SSH anomaly, and the inverse barometer effect from the atmosphere).
These common ocean data can be found in snapshot form (i.e., the 2081-2100 20-yr future mean minus the 1986-2005 20-yr historical mean) in the “separate-component-slr-rcp*.nc” files as the ocn_m (or _l, _h) variable, and as time series of maps, t,y,x, from 2007-2100 in the “component-ts-slr-*.nc” files, also as the ocn_* variables.
Please note that there are some details in the variable attribute notes in the files that may answer some questions, and other questions may be answered in either of the two studies which provided analyses and development methods for the data (Slangen et al. 2014; Carson et al. 2016). All other questions can be forwarded to the contact person listed below.
Parameters
| Name | Unit |
|---|---|
| for RCP 4.5, 8.5 and for every component: | |
| *m: middle value (i.e., central estimate) | m |
| *l: 90%CL lower uncertainty estimate (p=0.05) | m |
| *h: 90%CL higher uncertainty estimate (p=0.95) | m |
| *sd: standard error | m |
Coverage, temporal and spatial resolution
Period and temporal resolution:
- 2007 until 2100 (for ice data: 1986 to 2100)
- yearly
Coverage and spatial resolution:
- spatial resolution: 1°x1°
- Geographic Latitude: -90°N to 90°N
- Geographic Longitude: 0°E to 360°E
Format:
- netCDF
Data quality
See description.
References
Data citation
Please cite the data as follows:
Carson, M., A. Köhl, D. Stammer, A. B. A. Slangen, C. A. Katsman, R. S. W. van de Wal, J. Church, and N. White, 2016: Coastal sea level changes, observed and projected during the 20th and 21st century. Clim. Change, 134, 269-281, doi:10.1007/s10584-015-1520-1.
and acknowledge the source of your data download as:
Coastal sea level change data distributed in netCDF format by the Integrated Climate Data Center (ICDC, icdc.cen.uni-hamburg.de) University of Hamburg, Germany.