Projected sea level change and variability in the Southeast Asia region based on MPI-ESM-ER
by Yi Jin1, Armin Köhl1, Johann Jungclaus2, Detlef Stammer1 1. Center for Earth System Research and Sustainability, University of Hamburg, Hamburg, Germany
Southeast Asia (SEA) seas include the largest archipelago globally and provide an oceanic pathway connecting the Pacific and Indian Oceans. However, because of the complex coastline and numerous straits of this island region, the projected sea level change and variability have not been detailly discussed in previous coarse resolution simulations. In this study, based on a high-resolution (~0.1° for ocean model) coupled global climate model MPI-ESM-ER (Gutjahr et al. 2019), the projected change and variability of sea level are investigated based on the historical period 1950-2014 and under SSP5-8.5 scenario for 2015-2100.
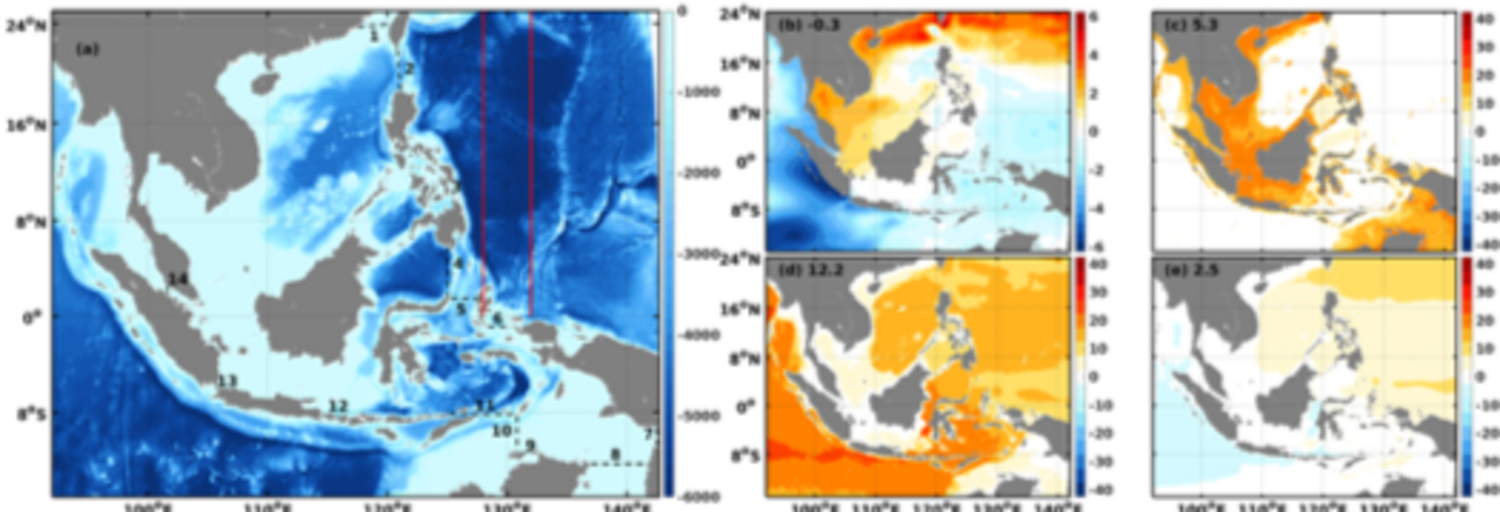
For the projected sea level changes, thermosteric sea level change is dominant in deep regions, while manometric sea level change is significant in shallow regions. Compared with the other two components, the halosteric sea level change is weak (Fig.1). For the sea level variability, every sea level component is highly correlated with ENSO, showing a close bond between SEA sea level and large-scale natural variability.
Owe to high-resolution simulation, we enclose the SEA seas by 14 straits (or channels) to investigate the contributions from individual straits compared with regional atmospheric. The most obvious changes are the heat and freshwater fluxes through No.2 and 4 straits (in Fig.1a), which show opposite trends and significant negative correlation (-0.93 and -0.66, respectively). Further flux decomposition indicates that these fluxes are mainly induced by changing volume transport, which is caused by the northward maximum current velocity in northwest Pacific region (Fig.2).
The following work will focus on the changes of the outflow side (to Indian Ocean), and its connection with inflow (from Pacific Ocean), which could be related with projected slowdown Indonesian throughflow (e.g., Shilimkar et al. 2022) and corresponding changes of South China Sea throughflow (Gordon et al. 2012).
References:
- Gordon A L, Huber B A, Metzger E J, et al. South China Sea throughflow impact on the Indonesian throughflow. Geophysical Research Letters, 2012, 39(11).
- Gutjahr, O. et al., Max Planck Institute Earth System Model (MPI-ESM1.2) for the High-Resolution Model Intercomparison Project (HighResMIP). Geoscientific Model Development , 2019, 12, 3241–3281.
- Shilimkar V, Abe H, Roxy M K, et al. Projected future changes in the contribution of Indo-Pacific sea surface height variability to the Indonesian throughflow. Journal of Oceanography, 2022, 1-16.